Strong US GDP and how it impacted Dollar and Forex Pairs
 Jun 26th, 2026
 5 mins


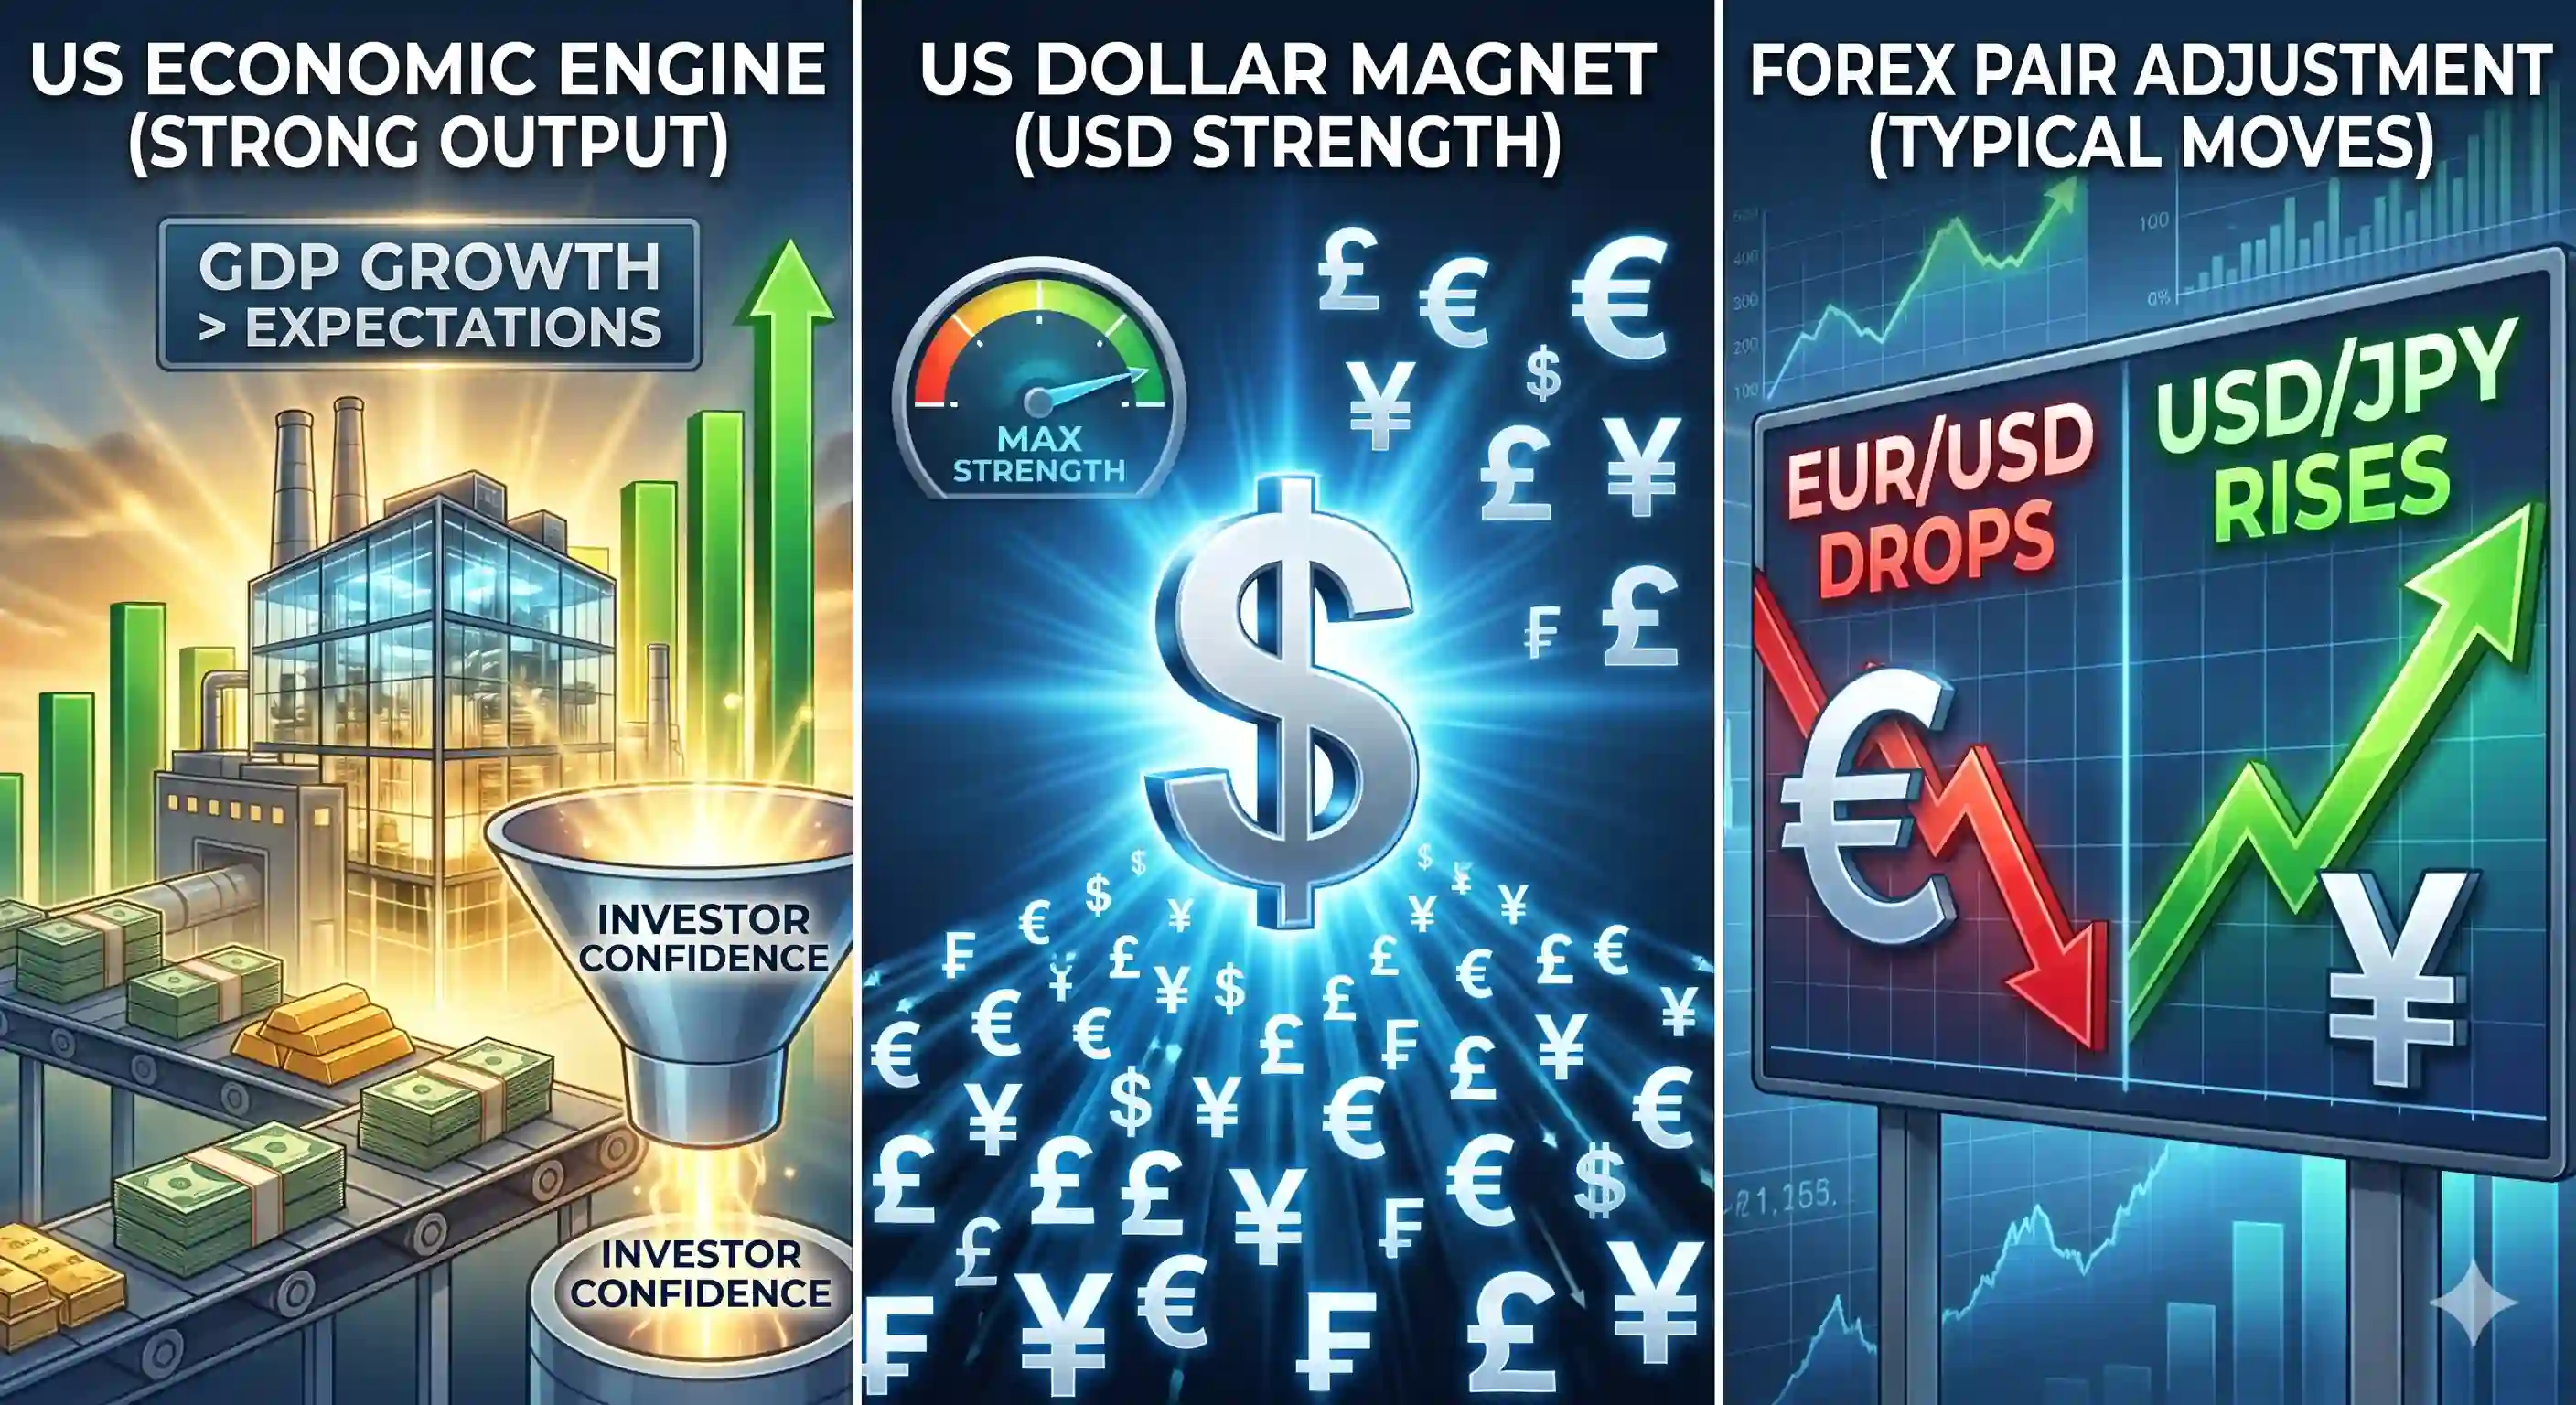
On June 25, 2026, the U.S. Bureau of Economic Analysis (BEA) published its third and final estimate for Q1 2026 Gross Domestic Product (GDP).
The headline number delivered a massive surprise: real GDP was revised sharply upward to an annualized rate of 2.1%. This marks an unusually large shift from the sluggish 1.6% reported in the second estimate, and it edges past the initial 2.0% advance estimate. While the surface data points to a strong economic expansion rebounding from a sluggish, shutdown-hampered Q4 2025 (which printed at just 0.5%), a closer look into the report reveals a deeper macroeconomic paradox.
1. Reasons: An Accounting Rebound vs. Fading Consumption
To understand the relevance of this release for the U.S. economy, market participants must look beyond the 2.1% headline figure. The upward revision was not driven by booming consumer demand. Instead, it was primarily a byproduct of global trade math.
● Trade Deficit Cushion: The primary engine behind the upward revision was a steep downward adjustment to import growth, which dropped to 11.8% from the previously stated 21.1%. Because imports are subtracted when calculating GDP, this sharp narrowing of the trade deficit drastically reduced the drag on net exports, adding nearly a full percentage point back to the final calculation.
● Consumer Slowdown: In stark contrast to the trade rebound, personal consumption expenditures (PCE) growth was revised down significantly to just 0.5%. This marks the slowest pace of consumer spending since Q1 2022, led by a severe slowdown in services demand like financial services and insurance.
● Sticky Inflation Realities: Compounding the consumption slowdown, the final price gauges confirmed that the U.S. economy is dealing with stubborn stagflationary dynamics. The Q1 PCE price index ticked up to a hot 4.6%, while the Core PCE price index (which strips out food and energy) held firm at an uncomfortable 4.4%.
Macroeconomic Relevance:
This data presents a massive challenge for the Federal Reserve. The underlying core demand measured by Final Sales to Private Domestic Purchasers—collapsed from 2.4% down to 1.7%. The American consumer is visibly fatiguing under the weight of tight credit conditions and a restrictive interest rate framework. However, because the headline GDP printed at a resilient 2.1% and core inflation is sitting at 4.4%, the Fed has no choice but to maintain its hawkish "higher-for-longer" monetary policy bias.
2. Market Execution: How the U.S. Dollar Reacted
The currency markets experienced a wave of two-way programmatic volatility following the release. Initially, algorithms responded to the headline 2.1% print by buying the U.S. Dollar Index (DXY), pushing it toward multi-week highs. However, as institutional traders dissected the report and exposed the weak 0.5% consumer spending metric, the dollar’s initial rally cooled. The greenback ultimately settled into a firmer, highly consolidated posture. The reality that the Fed cannot easily cut rates while headline numbers remain stable and inflation is high acted as a firm structural floor for the currency.
3. Performance Breakdown: Major Forex Pairs and Gold
The friction between a high headline growth rate and fading consumer spending drove distinct movements across major currency pairs and safe-haven gold.
USD/JPY
With the final GDP print confirming that the U.S. economy is not entering a sudden
slowdown, U.S. Treasury yields held onto their high ground. This kept USD/JPY heavily
supported, testing overhead technical zone of 162-163 as resistance and keeping traders
alert for direct currency intervention from Tokyo.
EUR/USD
The Euro remained under steady bullish pressure. The contrast between a slowing
Eurozone economy and a U.S. economy printing a 2.1% growth rate reinforced the wider
interest rate gap favoring the dollar ideally but weak consumer spending in US negates this
advantage. EUR/USD rallied from 1.1340 to 1.1390 approximately.
GBP/USD
The British Pound showed relative resilience against the dollar. Even as the UK navigates its
own internal political transitions and sticky services inflation, GBP/USD rallied from 1.3150
to 1.3210 approximately. Political uncertainties may not allow the price to rally strongly
therefore we can still expect price consolidation.
XAU/USD (Gold)
Ideally a strong GDP metric means the dollar will strengthen against the gold but the key is
the how US achieved such high growth, consumer spending fell and therefore we an say
that the numbers of GDP is just an accounting adjustment. It was because the Gold rallied
even after strong GDP numbers from $3973 to $4044 approximately.
The final Q1 GDP print provides an important lesson in looking past headline numbers.
While a 2.1% print keeps the U.S. Dollar protected from a sudden sell-off, the dramatic drop
in underlying private domestic demand to 1.7% suggests the economic engine is slowing
down under the surface. Trend traders should treat the dollar’s current strength with a
degree of structural caution heading into next month's initial Q2 data cycles.